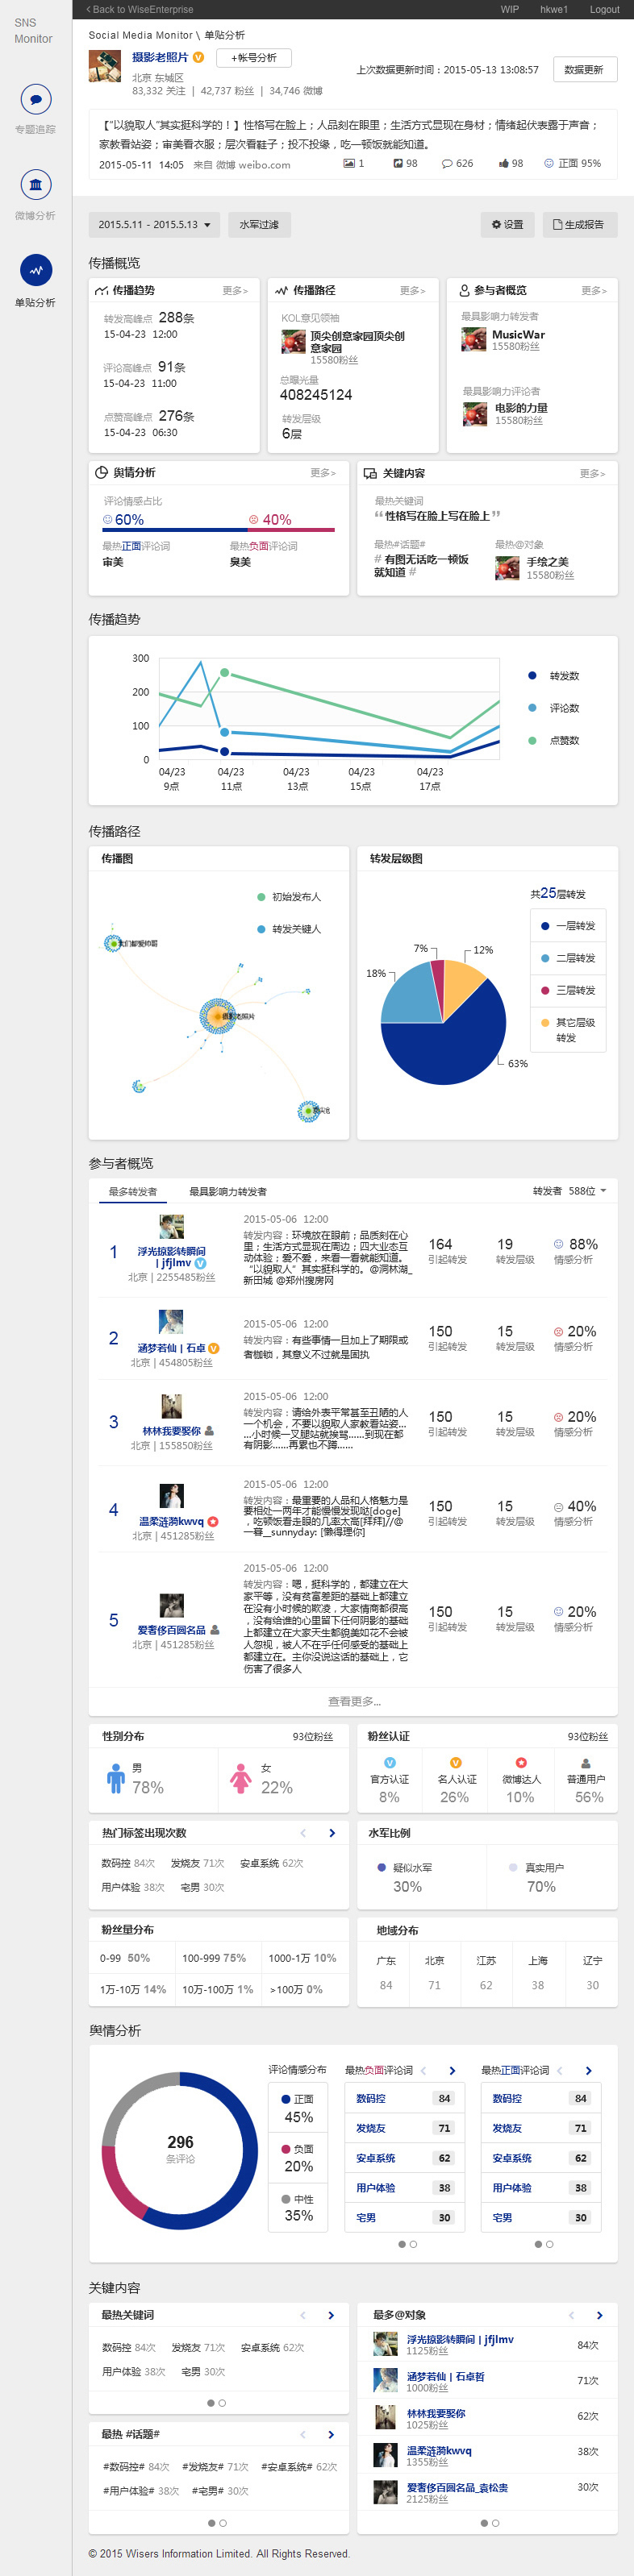
SNS Monitor – Social Media Analytics & Insight Dashboard
SNS Monitor is a data-driven platform that enables users to track, analyze, and extract insights from social media posts. It provides a comprehensive dashboard with real-time metrics, engagement analytics, and competitor insights, helping users make informed decisions and optimize their social media strategies.
- Category UX Design
- Company Wisers Information Limited
- Industry Information Technology & Media Intelligence
- Launch Date May 2015
My Role & Contribution
-
Led UX/UI design for a data-heavy analytics dashboard
-
Conducted user research to identify pain points in data interpretation
-
Designed user flows for insight discovery and analysis
-
Simplified complex datasets into digestible visual formats
-
Improved usability and engagement through better interaction design
Problem
- Data Overload:
-
Large volume of metrics overwhelmed users
-
Difficult to extract actionable insights
- Data Reliability & Integration:
-
Inconsistent data due to API integration issues
-
Missing or delayed social media data
- Real-time Complexity:
-
Fast-moving data required efficient processing and display
-
Users needed timely insights to react quickly
- Low Engagement:
-
Complex interface discouraged frequent usage
-
Users struggled to fully utilize available features
My Approach
I approached this as an insight extraction and data usability problem.
- Key focus areas:
-
Turning raw data into meaningful insights
-
Reducing cognitive load in data-heavy interfaces
-
Supporting quick decision-making through visualization
-
Improving engagement through clarity and usability
Solution
- Simplified & Customizable Dashboard:
-
Prioritized key metrics and reduced unnecessary noise
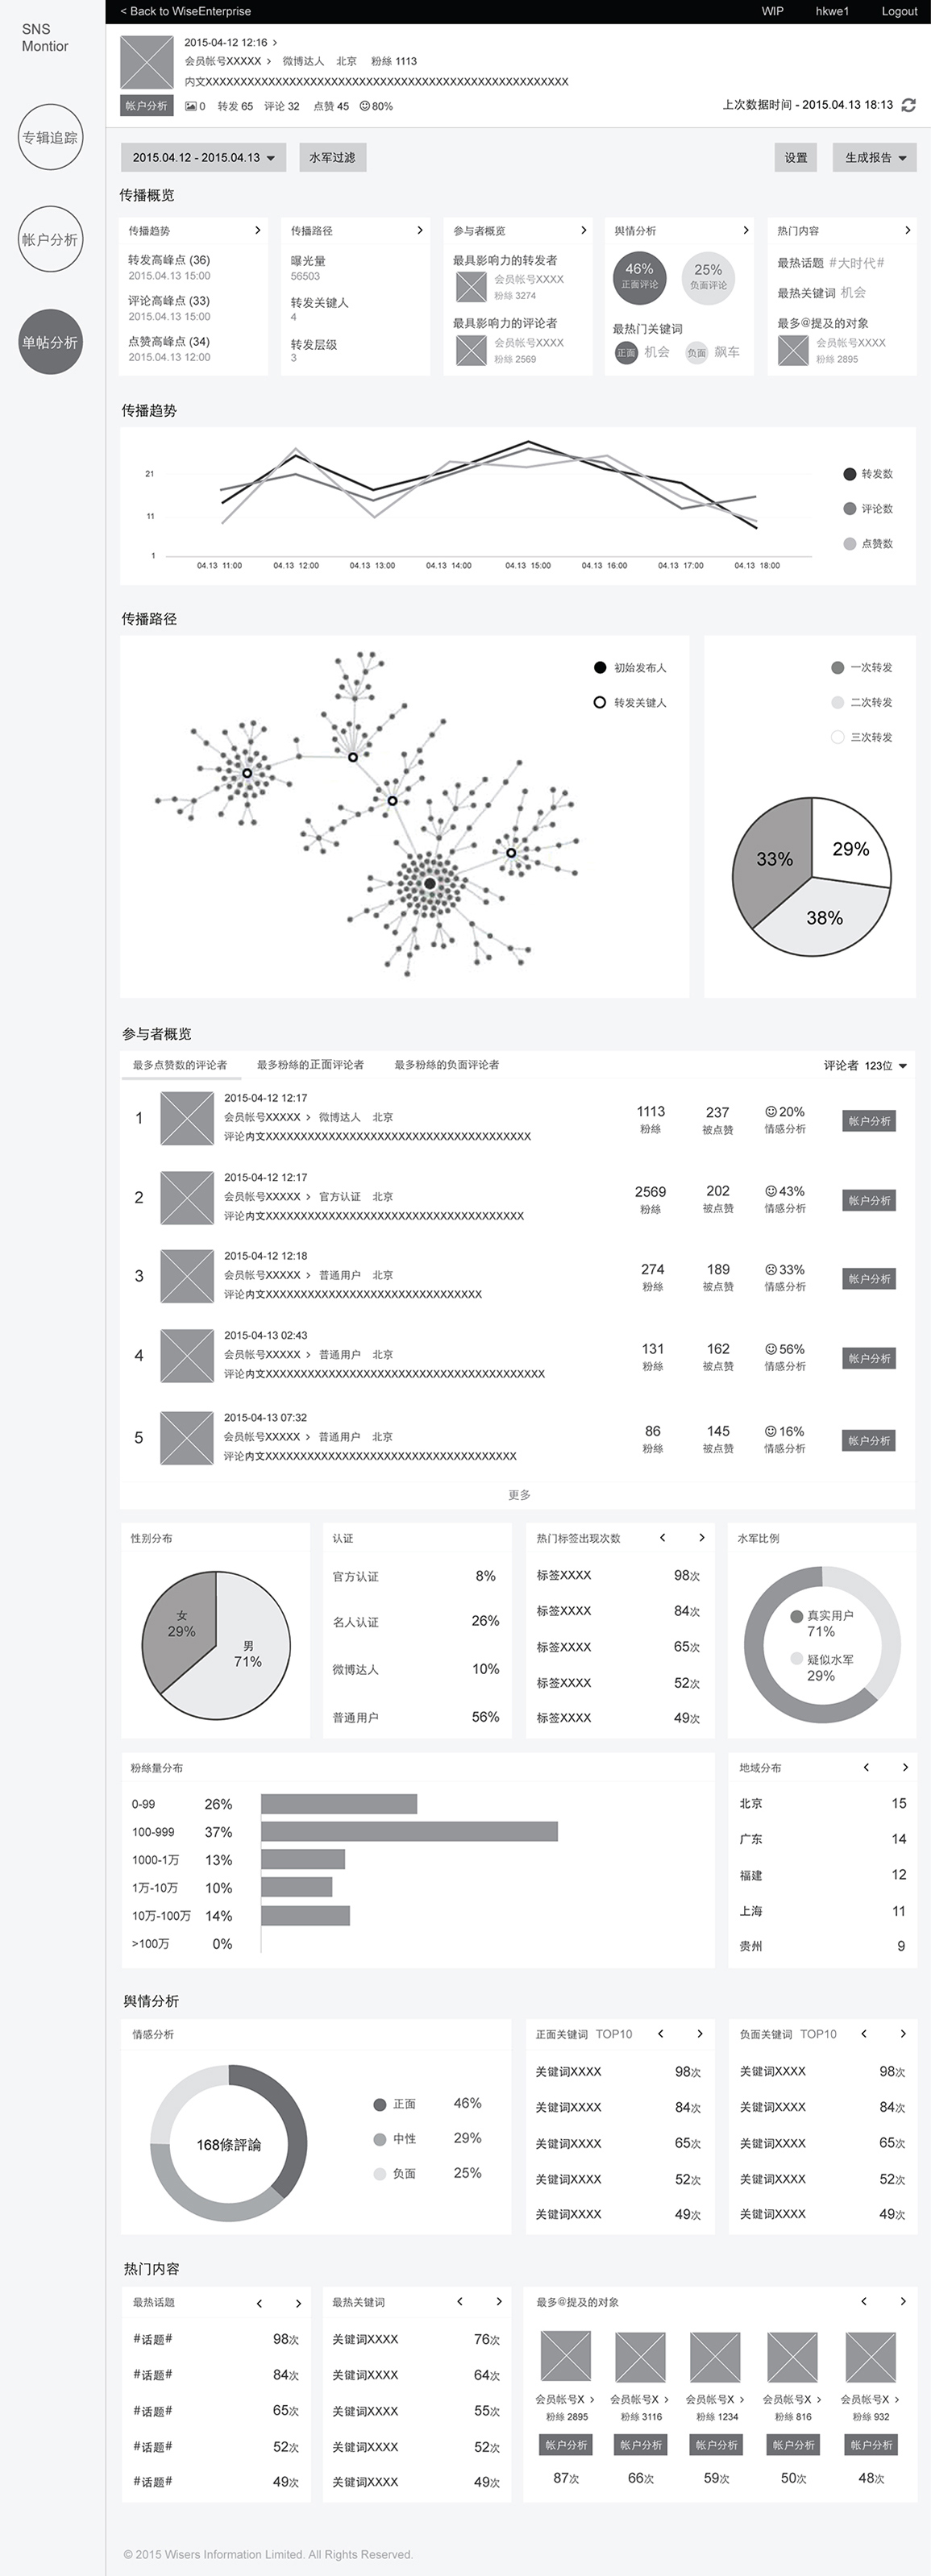
-
Used visualizations (charts, graphs) to improve data comprehension
-
Enabled users to focus on relevant insights
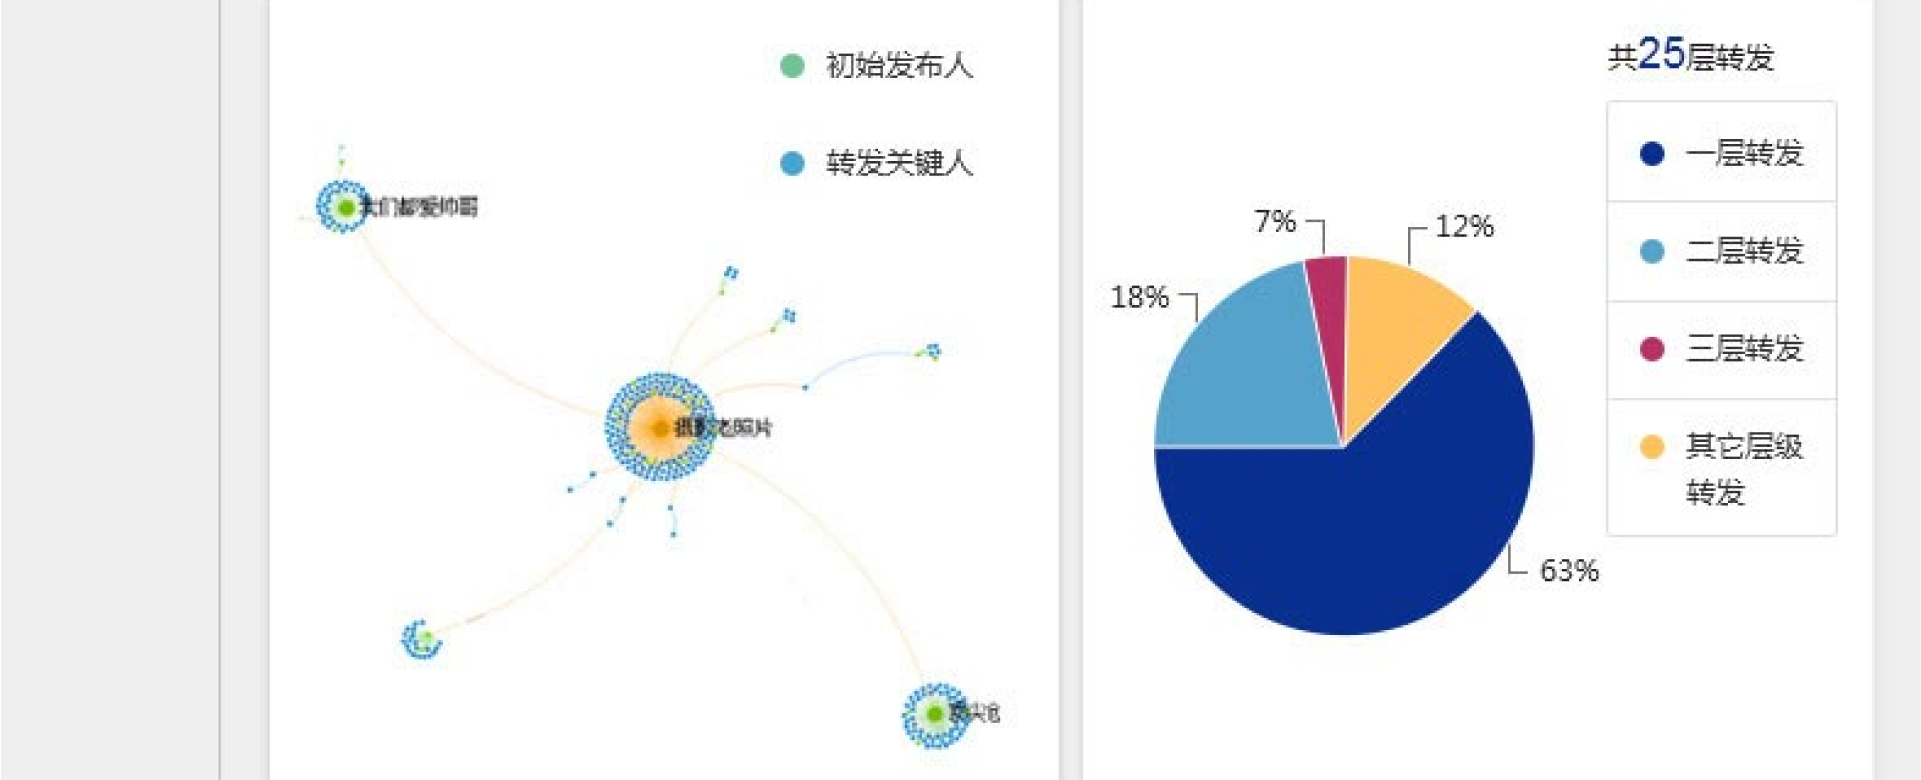
- Data Visualization Strategy:
-
Structured data into clear sections for trends, engagement, and performance
-
Improved readability and scanability of analytics
- Technical Collaboration:
-
Worked with developers to improve API integration
-
Ensured more stable and accurate real-time data processing
- User Enablement:
-
Conducted walkthrough sessions to guide users
-
Improved understanding and adoption of advanced features
Impact
-
Improved users’ ability to extract actionable insights
-
Increased engagement and frequency of platform usage
-
Faster response to social media trends
- Additionally:
-
Reduced cognitive load when analyzing data
-
Improved confidence in data accuracy and usability
Reflection
- This project reinforced that:
-
Data is only valuable when it’s understandable and actionable
-
Visualization plays a key role in decision-making
-
Reducing noise is as important as adding features
-
Collaboration with engineering is essential in data products